Iteris Adds Trend Maps, Route Alerts and Incident Data to ClearGuide

Iteris is excited to announce a new release for ClearGuide that now enables the Trend Map, Route Alerts and Incident Data features. These new features allow users to:
- Better understand traffic trends by day of week and time of day
- Customize route alerts and receive emails any time the data exceeds preset thresholds
- Integrate incident data from sources like WAZE, HERE and transportation agencies
Trend Map
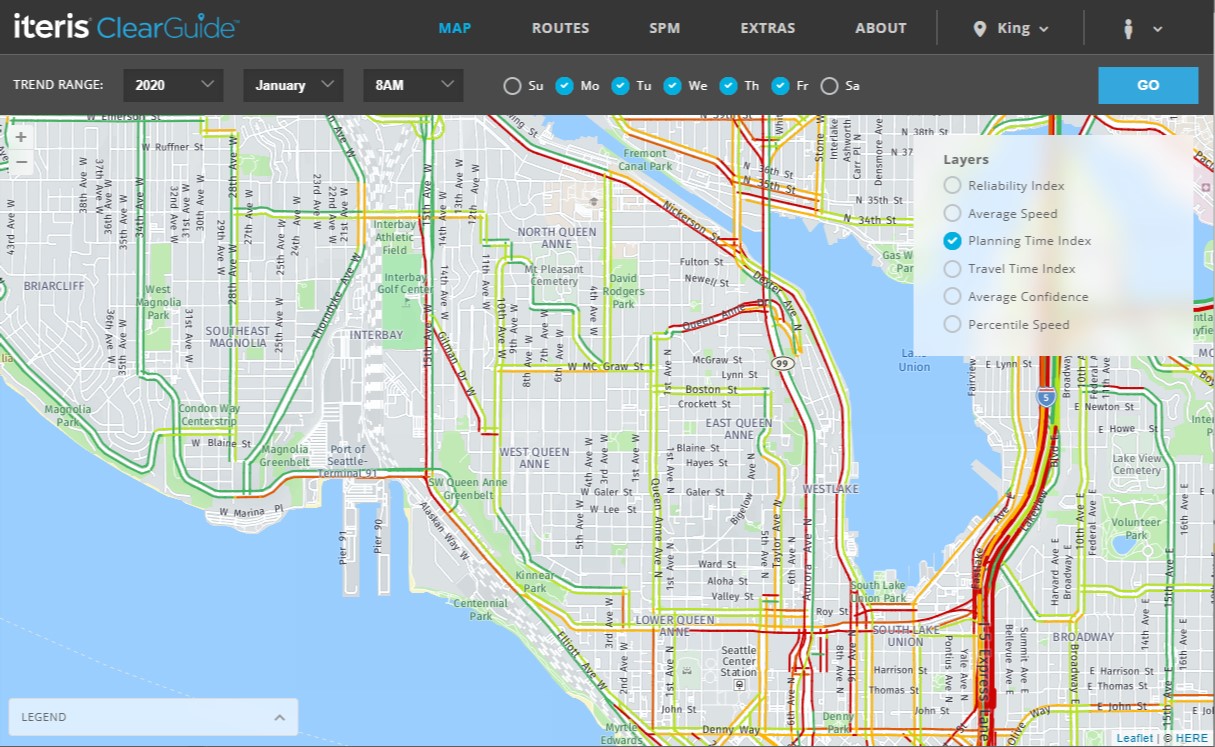
The new Trend Map feature displays monthly congestion and reliability trends by day of week and time of day. These trends can be used to:
- Identify unreliable roadway segments that can be improved with operational strategies
- Understand trends from year to year and seasonally
- Quickly identify congestion hotspots during peak hours
- Identify arterial corridors for potential signal timing improvements
- Identify roadways with potential speeding issues
Route Alerts
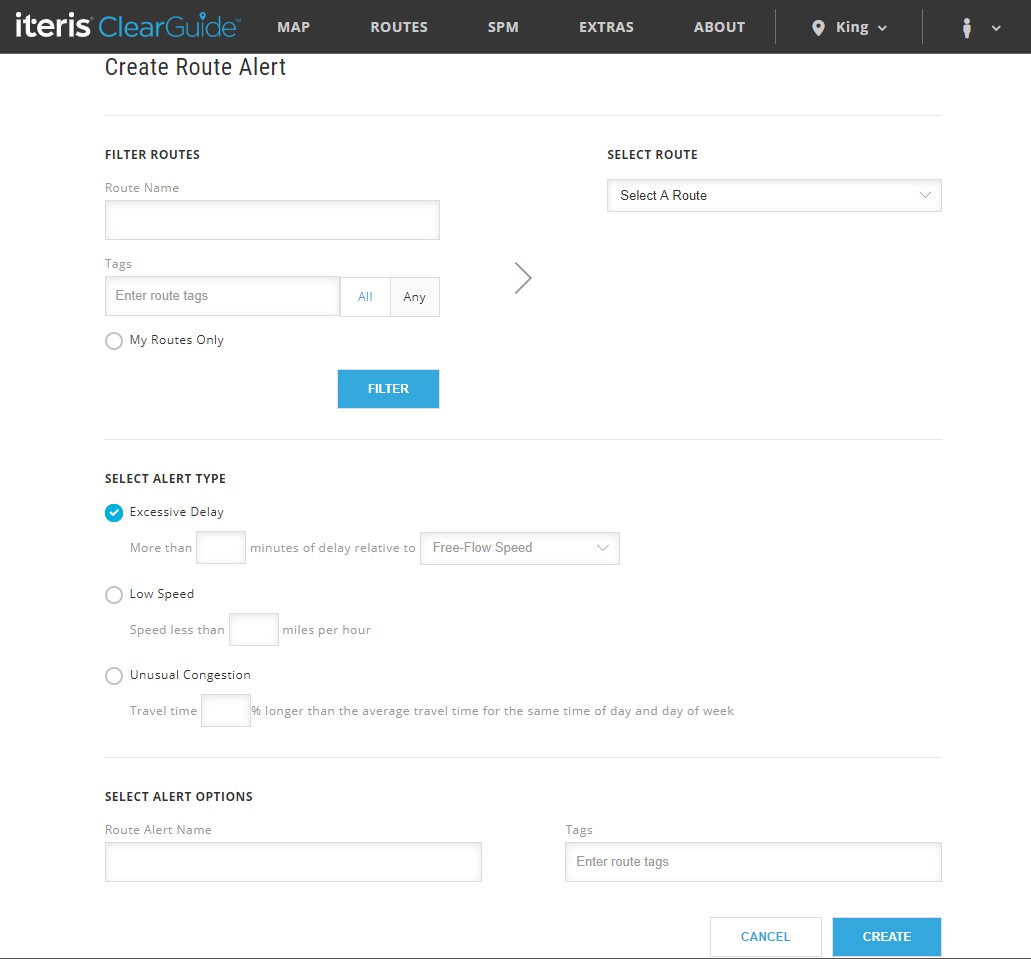
ClearGuide route alerts allow each user to configure customizable alerts on routes and receive emails any time the data exceeds preset thresholds. These alerts allow traffic engineers to understand:
- Excessive delay travel times that exceed a user-defined threshold
- Low speeds that fall below configurable speed thresholds
- Unusual congestion where real-time travel times reach a pre-defined threshold above average conditions along the route.
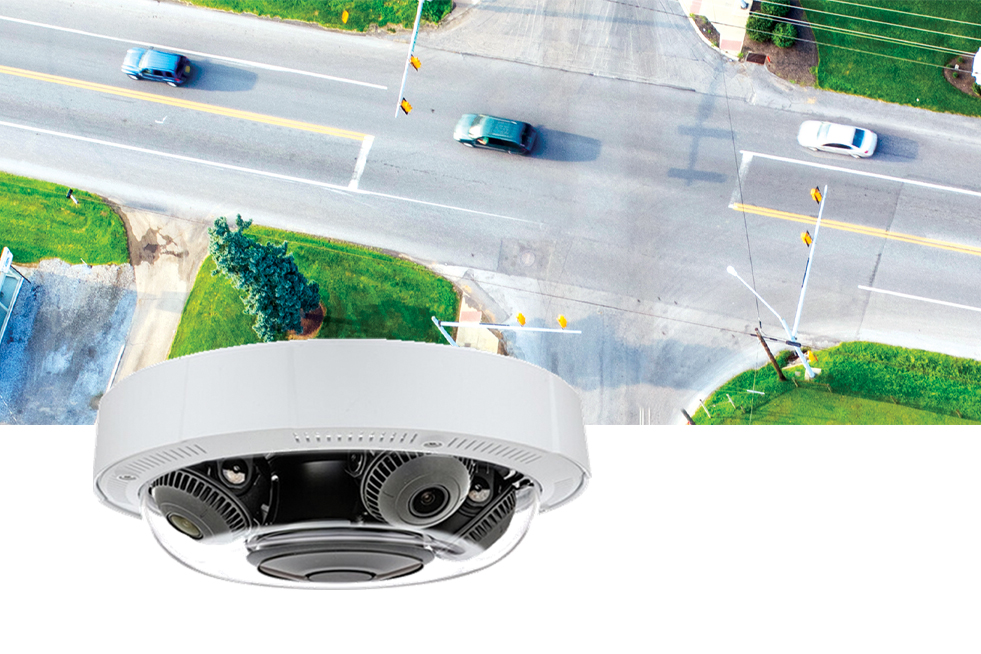
Incident Data

ClearGuide is now able to integrate incident data from sources like WAZE and HERE, as well as crash data from agencies, and display it on the real-time map and in the animation feature.
Release notes from the product owner
“Inspired by a client who wanted to create a "Reliability Index," we categorized roadway segments into four categories: First, fast and reliable; Second, fast and unreliable; Third, slow and reliable; and Fourth, slow and unreliable. Prior to ClearGuide, this client would manually calculate and visualize this metric on printed map for key corridors to facilitate discussion on priorities and strategies. With ClearGuide, we expanded the concept to allow users to see trends for additional performance measures in dynamic sharable maps with filtering capabilities.”
– Tiffany Symes, director of product, Transportation Analytics, Iteris.
About the Author:

James Esquivel is a marketing manager at Iteris.
Connect with James on LinkedIn.

 X
(Twitter)
X
(Twitter)
 Facebook
 LinkedIn
 Copy
Link
Copy
Link Email
EmailRelated Posts

ITS America 2026: Real Conversations, Real Momentum and What Comes Next
How Agencies are Modernizing Small Intersections