Back to School in 2021 Presents New Challenges – Are Districts Meeting Them?

On the heels of National Pedestrian Safety month, counties across the country are recognizing that the effective, free flow of people movement is more than simply the effective, free flow of moving cars. This means adding more space for walking and biking, as well as creating more protected crossings.
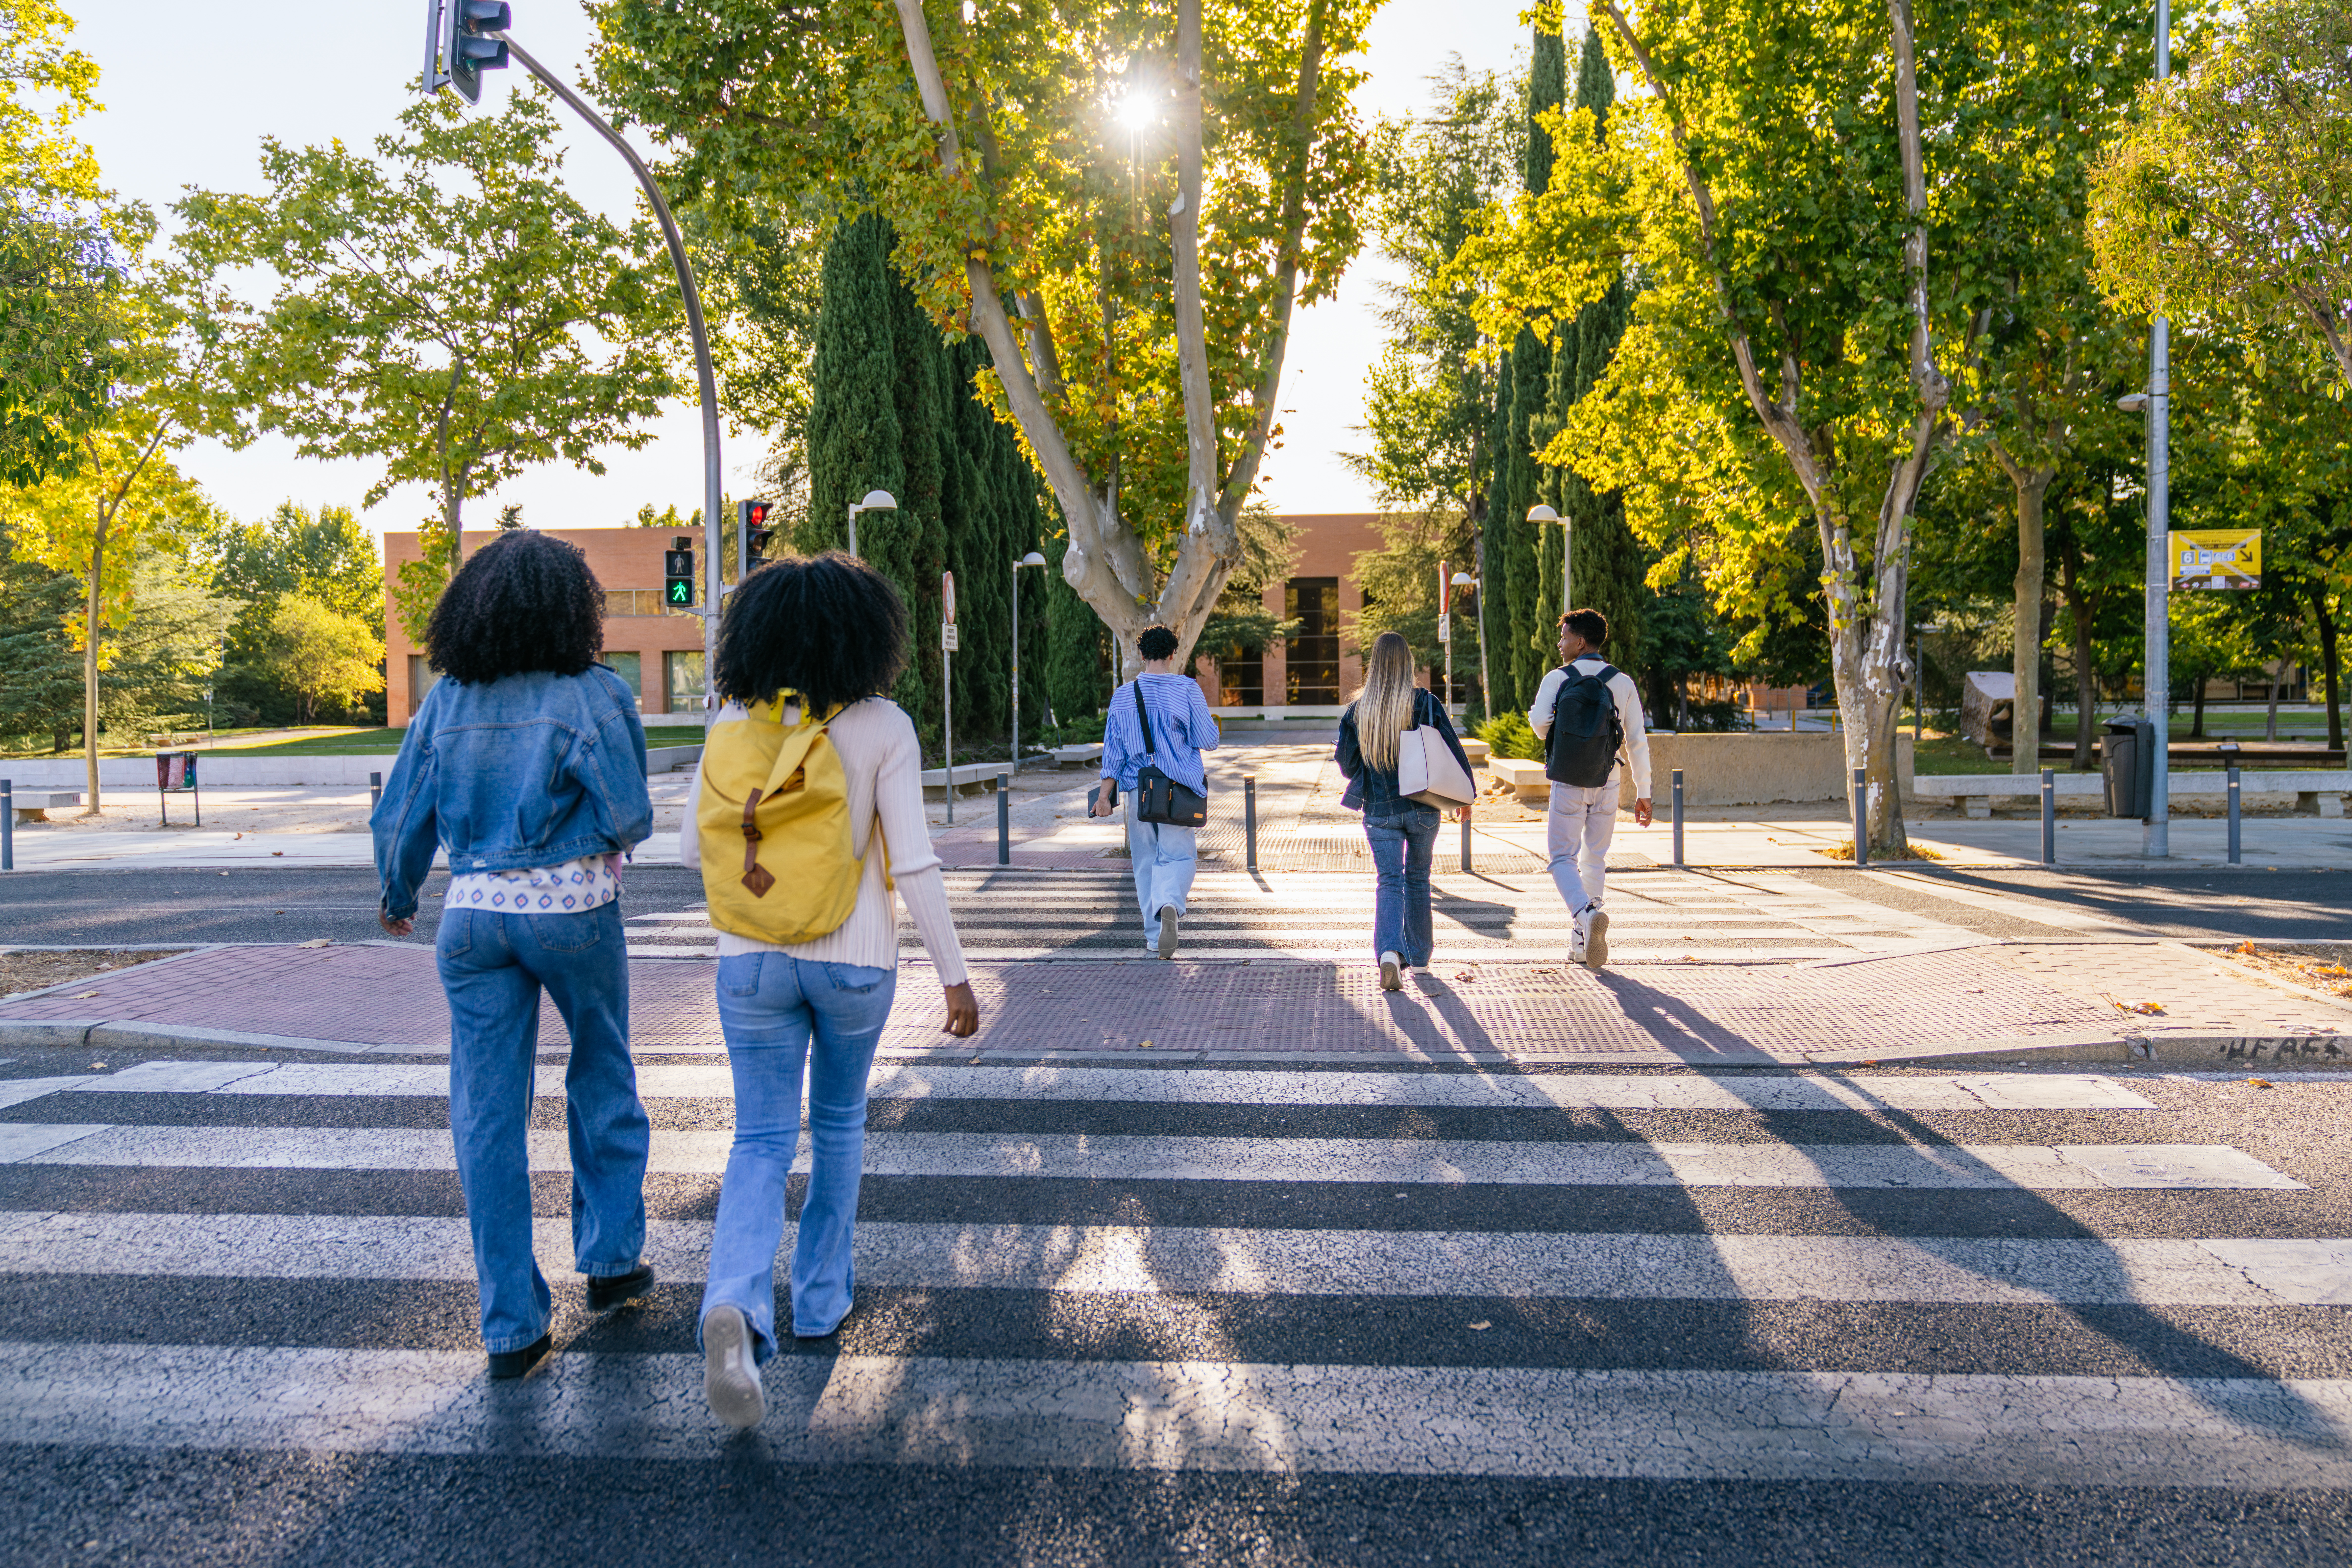
High vehicle traffic volume and speed are major contributors to worse pedestrian roadway safety outcomes. And just as cities and towns are fully opening up and returning to pre-pandemic traffic levels, students are also returning to in-person schooling – often on foot. In fact, due to social distancing practices still in place in many districts, to avoid the overcrowding of buses, more children than ever are making their way to school by walking. Lingering parental concerns about overcrowded school buses can also lead many to opt to drive their kids to school, contributing yet more to increased traffic volume and pedestrian safety risk.
These vulnerable road users (VRUs) require both additional and safer existing pedestrian routes from neighborhoods and mass transit stops to schools. There is therefore a need for counties to better understand where increases in traffic speed, volume and congestion are occurring most to better apply safety measures to areas where children returning to school on foot may be the most vulnerable.
Get a free analysis for your region.
Iteris can help
To aid in this effort, the Iteris Transportation Analytics team, using its proprietary ClearGuide™ smart mobility software, has developed a Back-to-School Safety Index that can help counties assess relative risk. The Back-To-School Safety Index can compare current, back-to-school traffic volume and speed with:
- Summertime vehicle traffic volume and speed
- Height-of-pandemic vehicle traffic volume and speed
- Pre-pandemic back-to-school vehicle traffic volume and speed
Current back-to-school traffic volume and speed reports can be shown as a percentage increase or decrease from baseline values reflected in each of the above timeframes. The index can also show where vehicles are consistently above the speed limit in zones near VRUs. The index is calculated for schooltime travel hours using probe data provided by HERE Technologies. The performance measures ClearGuide examines include speeding above the limit, travel time changes and back-to-school congestion increases.

A sample analysis from Hillsborough County, FL, showing back-to-school congestion/volume increases compared to July, as well as vehicles above the speed limit in VRU zones.
Get a free analysis for your region.
Strategies once hotspots are identified
There are several steps schools and counties can take to increase the safety of VRUs around schools:
- Use cones or bollards to seasonally remove traffic lanes to create better physical barriers between VRUs and vehicle traffic
- Provide more crossing guards at more crossings to increase access to schools from different directions
- Prioritize construction that improves sidewalks and connectivity between schools and neighborhoods
Schools can also leverage some of the same pandemic-era measures that increased social distancing, to increase pedestrian safety:
- Dismiss groups of students at different times, giving those cycling or walking home a head start before parents arrive in cars to pick up their children
- Allow students to enter schools from previously locked back entrances, so neighborhoods behind schools have a shorter, more direct walking route
- Drop off students farther from school to decrease parking lot congestion (and increase children’s fitness)
A perfect storm…averted?
Over the summer, both foot traffic and vehicle traffic were lighter. Months later and with schoolrooms again filling, not only is foot traffic much heavier – and heavier than at the equivalent time of year before COVID – but so is vehicle traffic, as commuting naturally resumes at volumes much closer to pre-pandemic levels.
Armed with detailed data on roadway use and effective strategies to mitigate risk, schools and counties can make back-to-school safer, greener and healthier for VRUs, helping to ensure that National Pedestrian Safety month is every month.
Get a free analysis for your region.
About the Author
Jeff Venables is marketing manager, smart mobility applications at Iteris.
Connect with Jeff Venables on LinkedIn
 X
(Twitter)
 Facebook
 LinkedIn
 Copy
Link
 Email
Email

