From Stadium to City Streets: What ClearGuide Revealed About Super Bowl LX Traffic Impacts
The Super Bowl doesn’t just fill a stadium. It temporarily rewires how a city moves. For travelers, operators and agencies, it’s one of the most demanding real-world stress tests a transportation network can face for event traffic management and traffic signal performance.
So how does a city actually perform during the Super Bowl? The data shows that traffic impacts are intense and highly localized, and when agencies have the right analytics, they can be actively managed rather than just endured.
Using ClearGuide®, Iteris’ real-time traffic analytics software, we analyzed Super Bowl LX traffic in two places that felt the strain most. Around Levi’s Stadium in Santa Clara County on Super Bowl Sunday, and in downtown Seattle during the championship celebration the following Wednesday. What emerged is a close look at where the network worked hardest, how travelers adapted, and what data-informed operations can accomplish under extraordinary demand.
Santa Clara on Game Day: What Operators Felt in Real Time
The analysis area around Levi’s Stadium included 514 signalized intersections. Within that footprint, ClearGuide’s AI-powered anomaly detection feature, which identifies when traffic signal performance deviates from expected, seasonal patterns, discovered 1,592 anomalies on Super Bowl Sunday, February 8 — a 50 percent increase compared to the previous day, and 41 percent more than the following Monday, February 9!
Of the intersections in the study area, 271 experienced at least one anomaly that day, which represents 63 percent of the total.
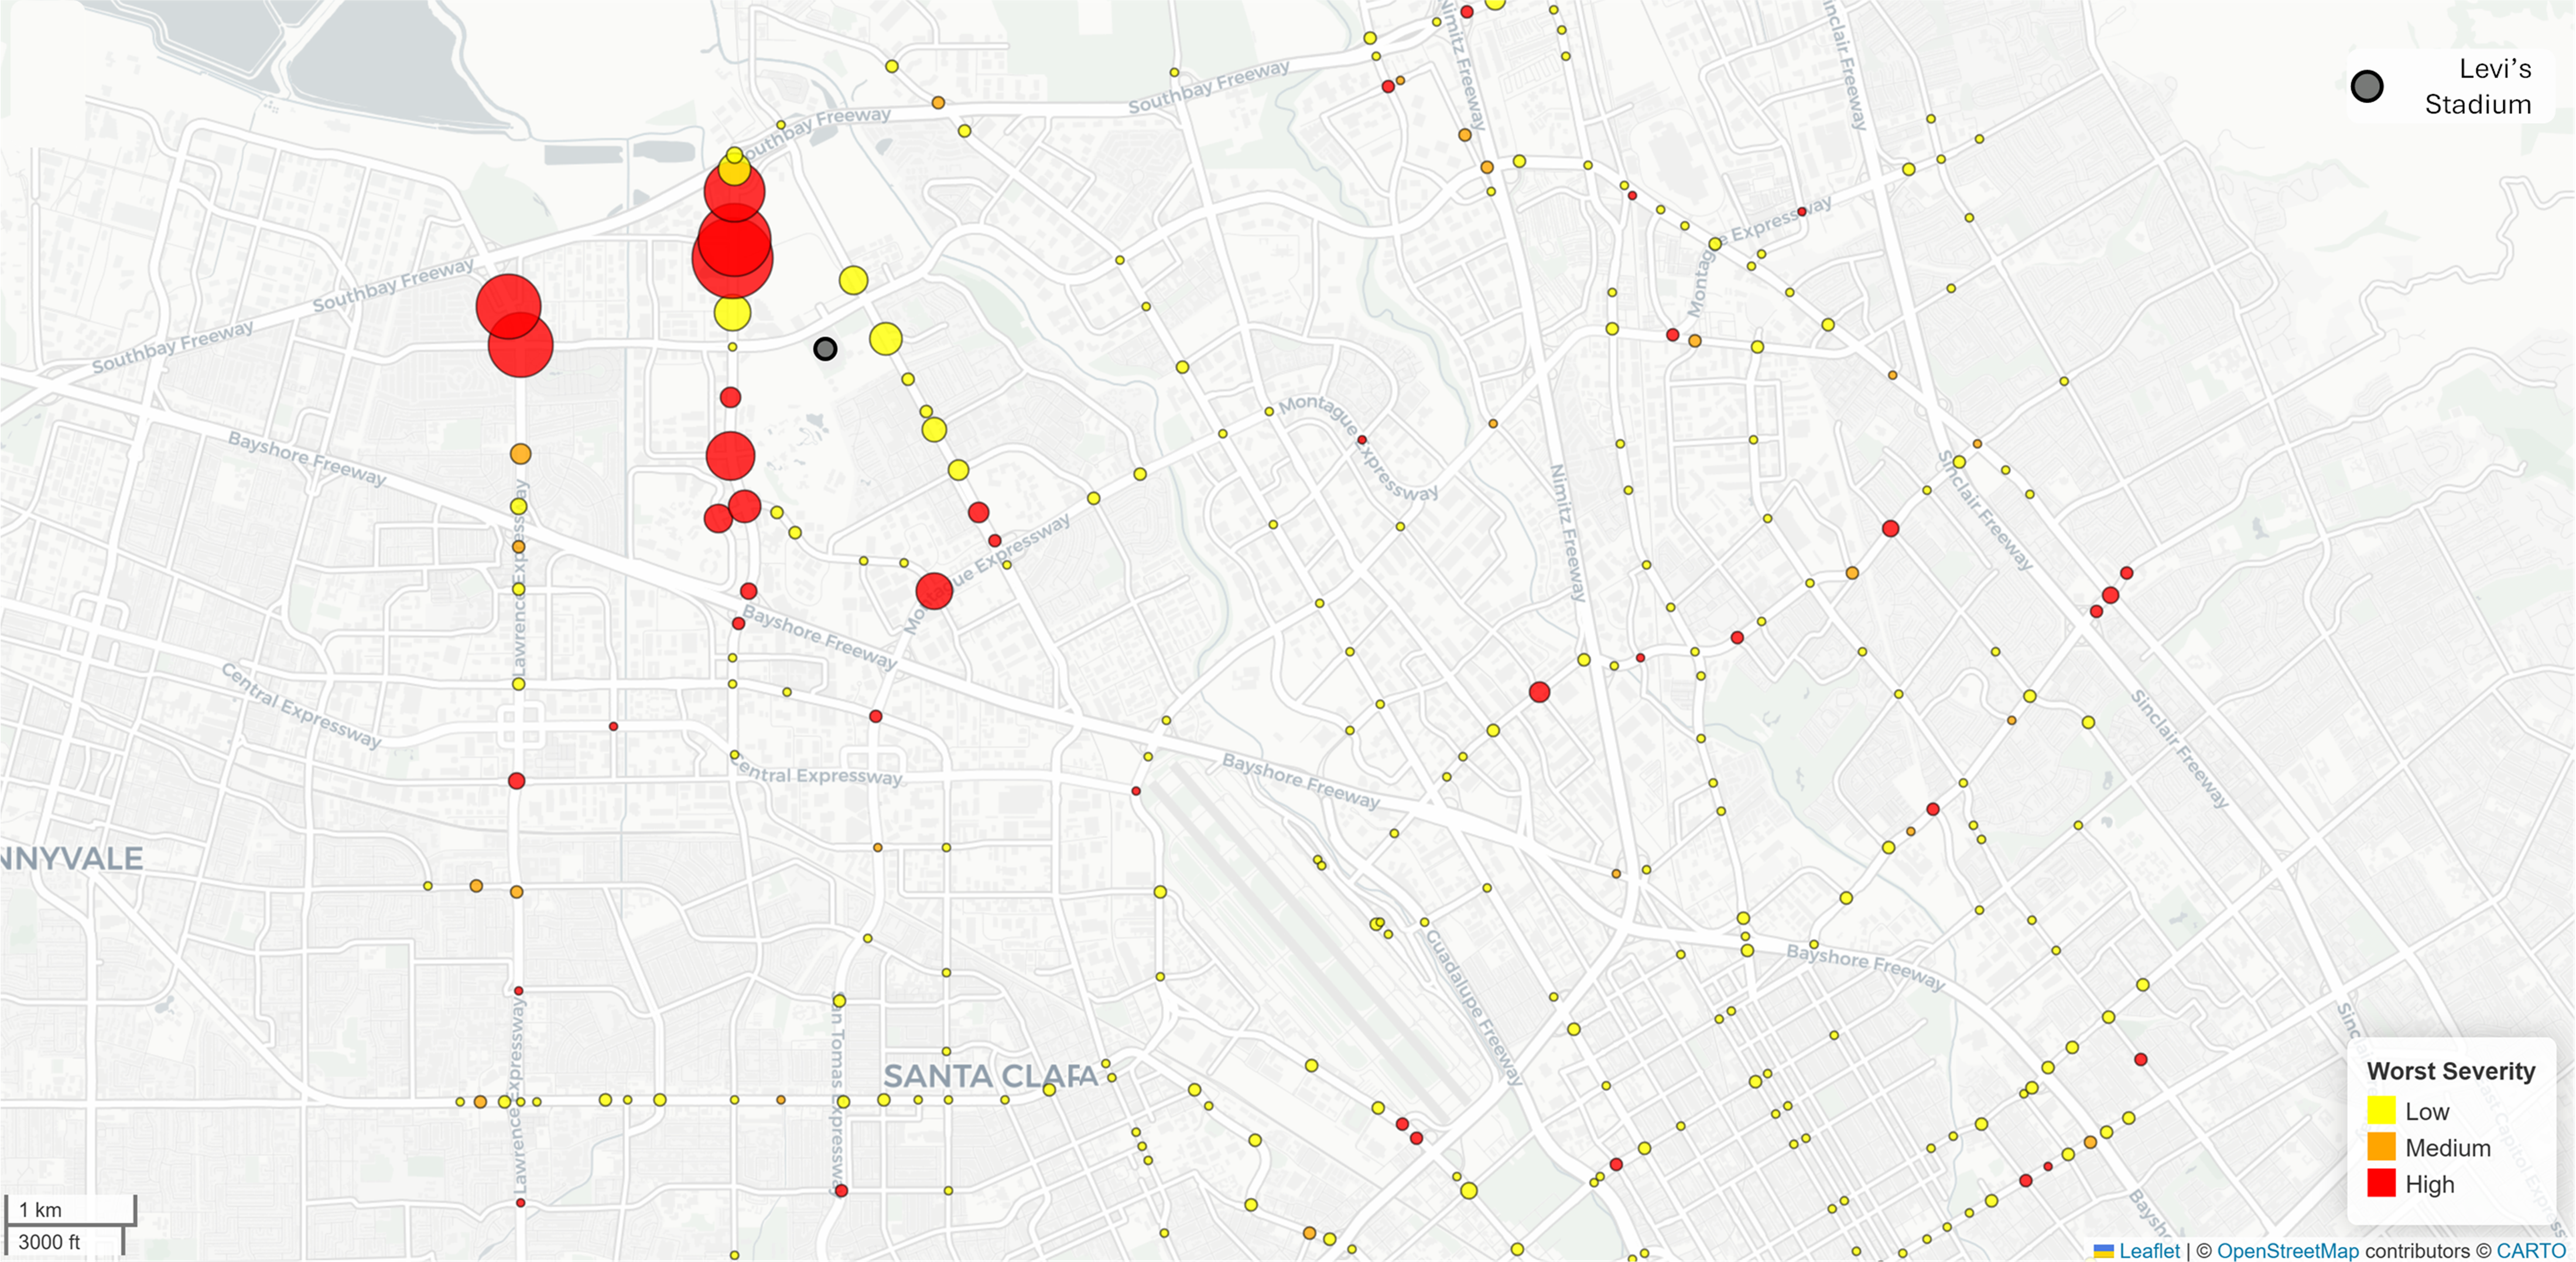 FIGURE 1: Anomalies near Levi's Stadium on Sunday 2/8
Severity patterns help explain what travelers felt on the ground. On Sunday, the anomaly mix skewed toward lower intensity disruptions, with 1,277 low severity anomalies, 123 medium severity, and 192 high severity. The highest concentrations were closest to the stadium perimeter, which reflects the concentrated comings and goings associated with the game and related activities.
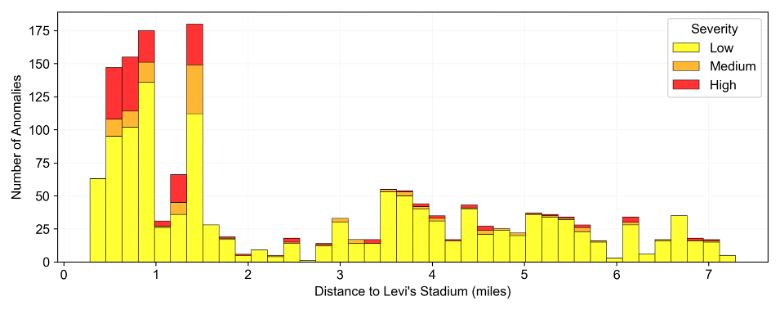 FIGURE 2: Distribution of anomalies in relation to Levi's Stadium on Sunday 2/8
That spatial pattern is captured above in FIGURE 1, where marker size denotes the number of anomalies, and the stadium is marked in black. FIGURE 2 then summarizes how far those anomalies occurred from the stadium, reinforcing how impact intensity changed with distance from the stadium.
Even within a single corridor, the data shows how demand pressed on specific movements. On Great America Parkway, southbound through movement registered the most anomalies of any intersection in the Santa Clara study area.
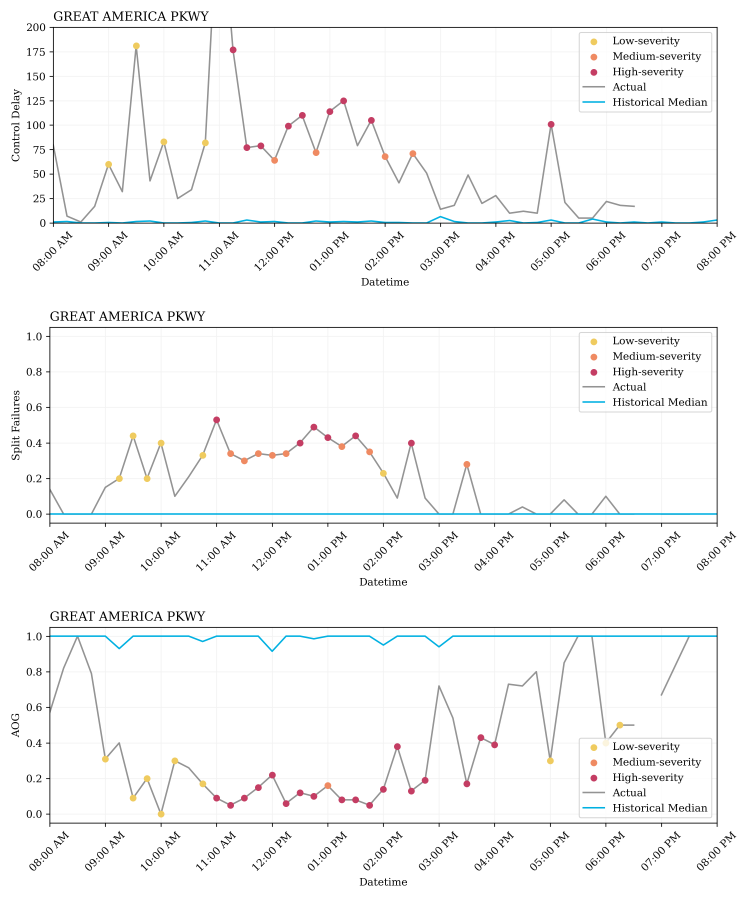 FIGURE 3: Anomalies by control delay, split failures and arrivals on green (AOG) at GREAT AMERICA PKWY on Sunday 2/8
FIGURE 3 above details the metric-level behavior for this movement. There were periods where delays increased more than 150 seconds compared to normal conditions. Split failures rose above 50 percent. Arrivals on green fell by more than 80 percent. These values align with what operators often observe during intense, yet time-bound surges near major venues. They also highlight why small operational decisions can make a large difference in perceived reliability.
Seattle’s Day of Celebration: Managing Downtown Event Traffic After the Super Bowl
The story in Seattle is about a celebration rather than a kickoff. On Wednesday, February 11, hundreds of thousands of Seahawks fans gathered at Lumen Field and in the streets downtown. To understand how that moment played out on the network, the analysis focused on 257 intersections inside downtown and compared Wednesday, February 11 (the day of celebration) to the day before.
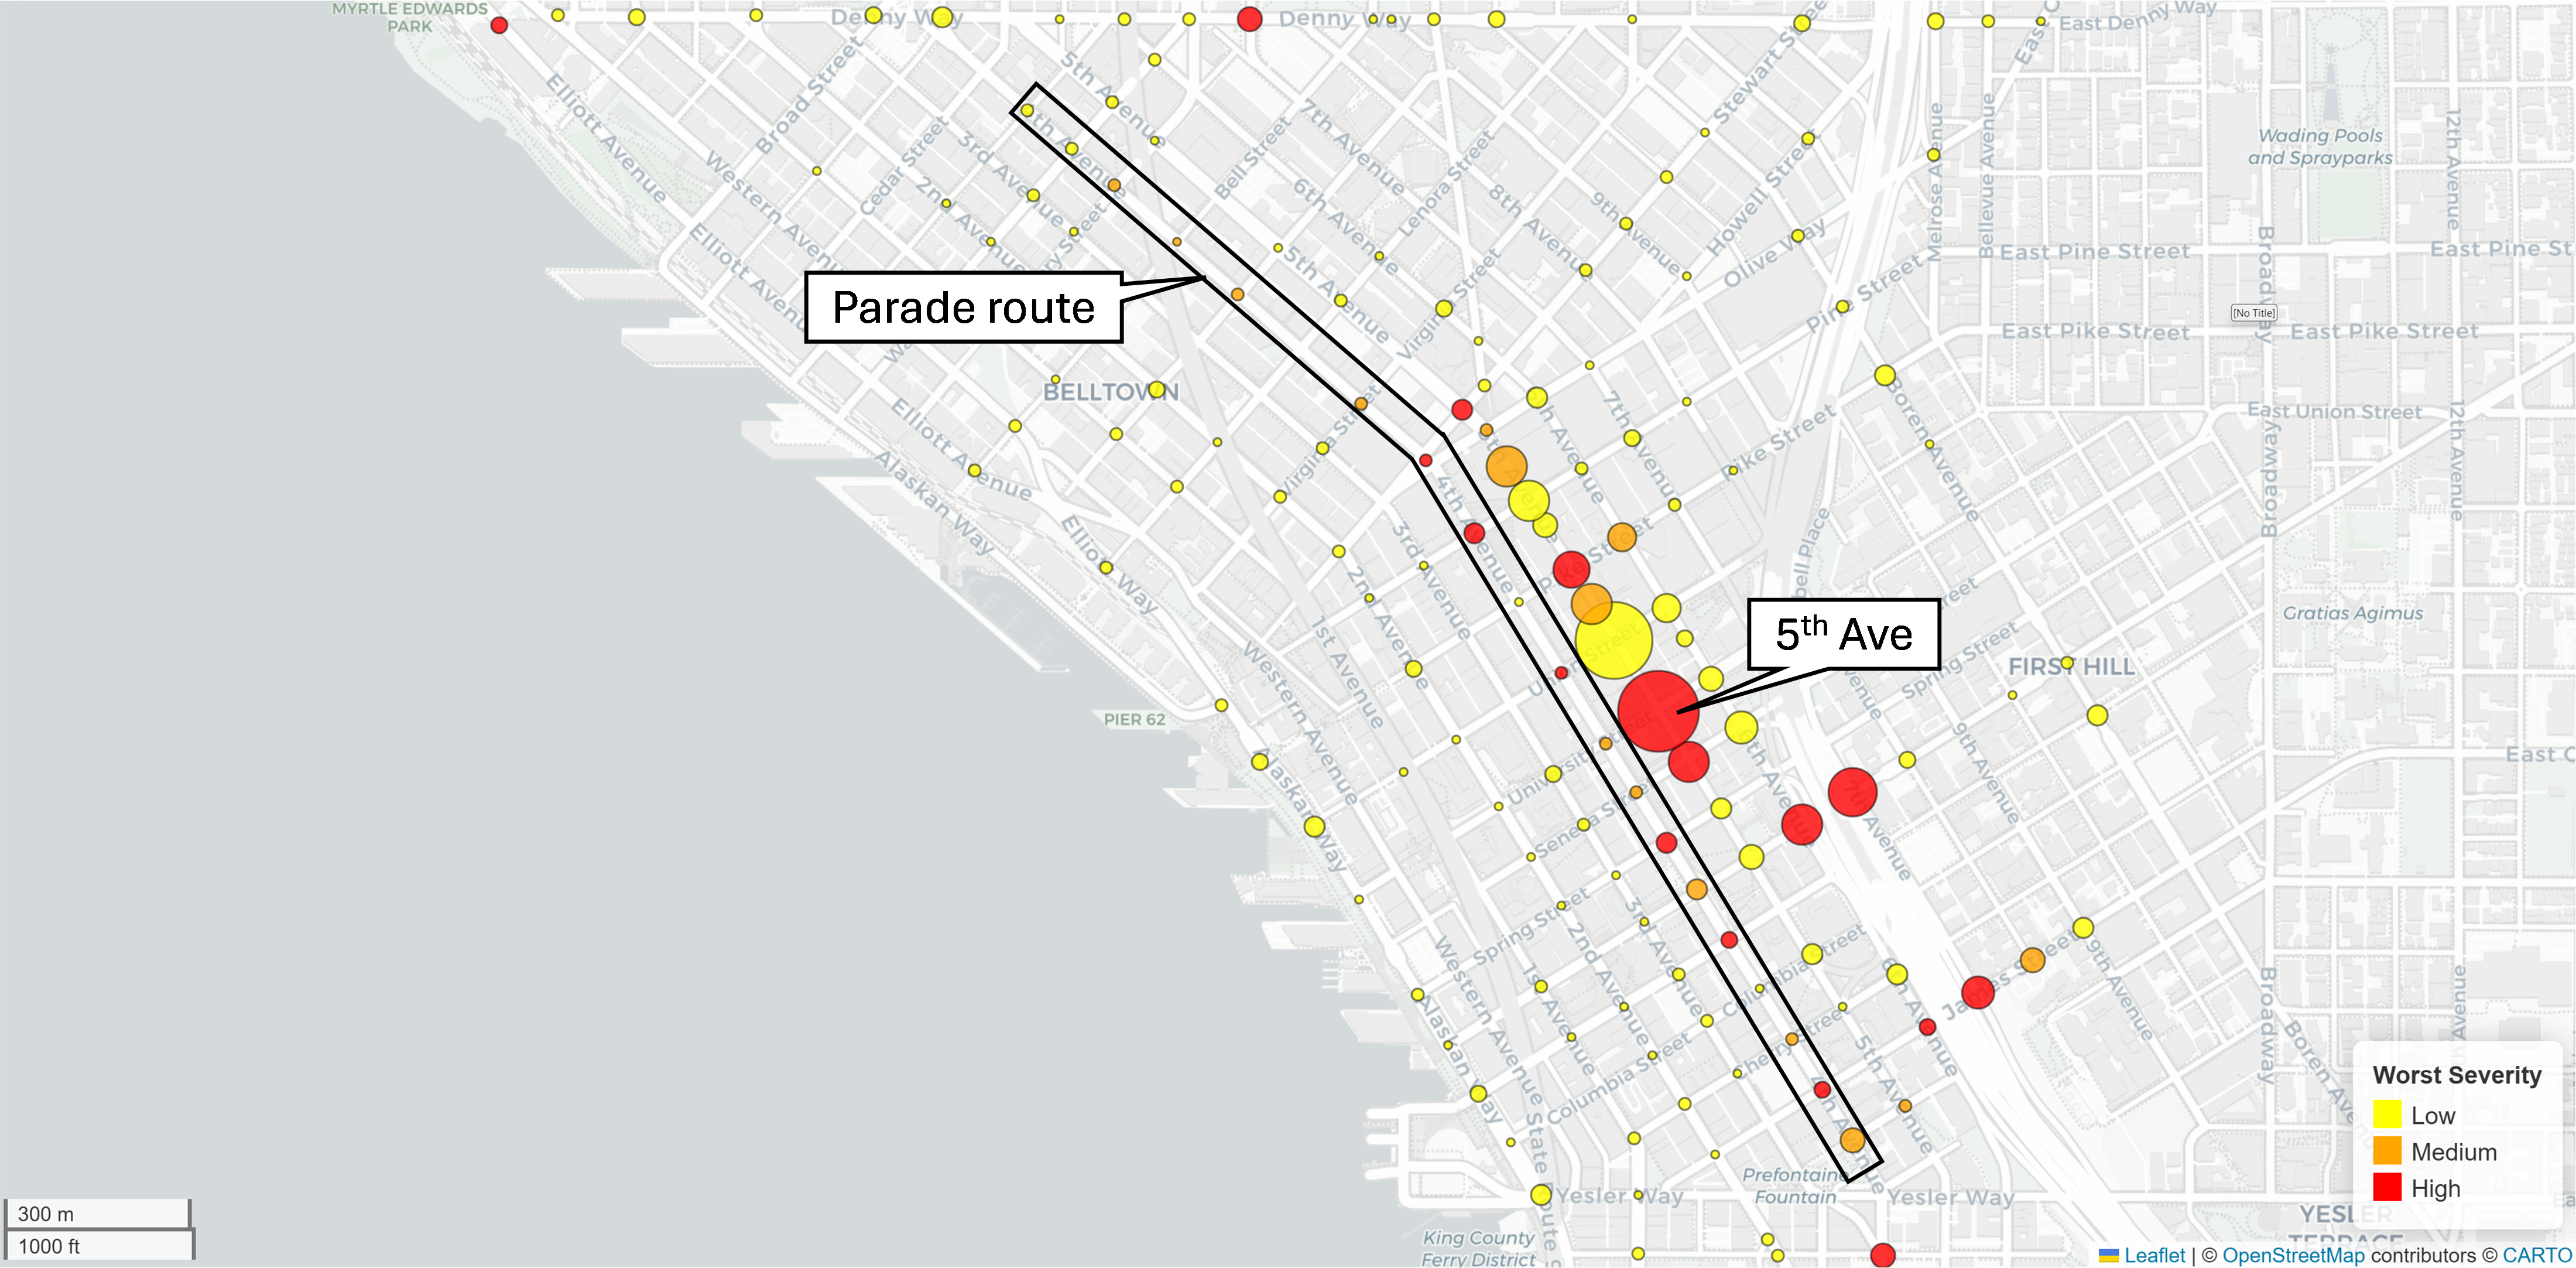 FIGURE 4: Super Bowl LX celebrations impact in downtown Seatle on Wednesday 2/11.
The change was huge! Wednesday recorded 629 anomalies, which was a 157 percent increase over Tuesday. One hundred fifty intersections registered at least one anomaly, or 58 percent of those evaluated. The distribution by severity again leaned toward lower intensity effects, with 555 low severity anomalies, 47 medium, and 27 high.
The map in FIGURE 4 above shows how the footprint of celebration influenced nearby streets. Fifth Avenue, which runs parallel to the parade route, was most affected.
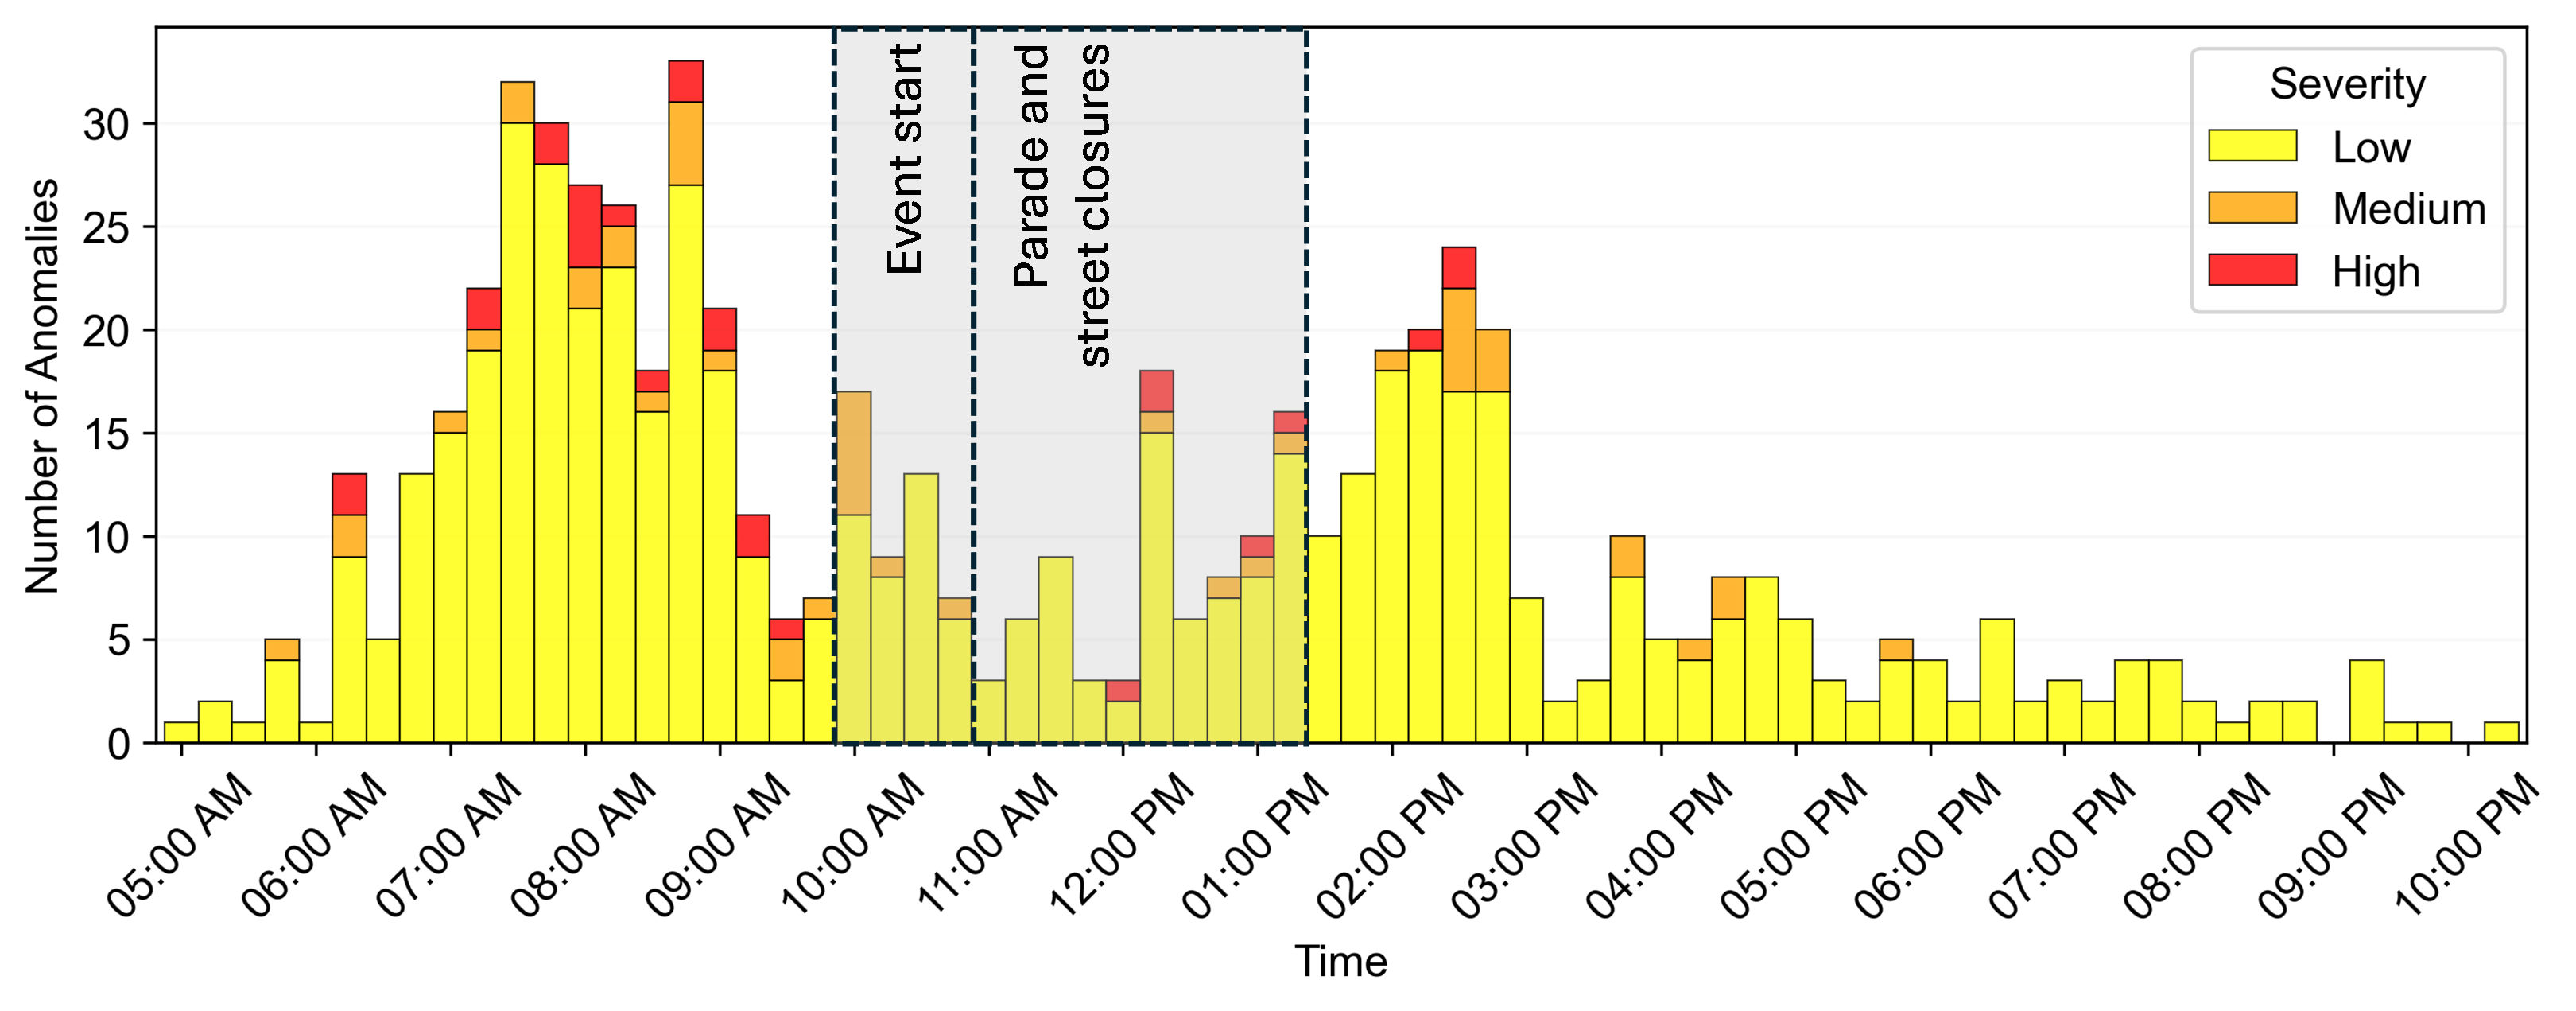 FIGURE 5: Anomalies by time-of-day on Wednesday 2/11.
An hourly view of the data adds an important human layer. FIGURE 5 above marks the time the celebration began and the period when the parade was underway and streets were closed.
The highest anomaly peaks occurred just before and just after those time windows. That pattern is consistent with arrival waves as fans gathered, followed by dispersal as people moved to transit, rideshare, or post-event activities. It shows a crowd that moved in pulses rather than in a single surge, which reduces the chance of prolonged gridlock.
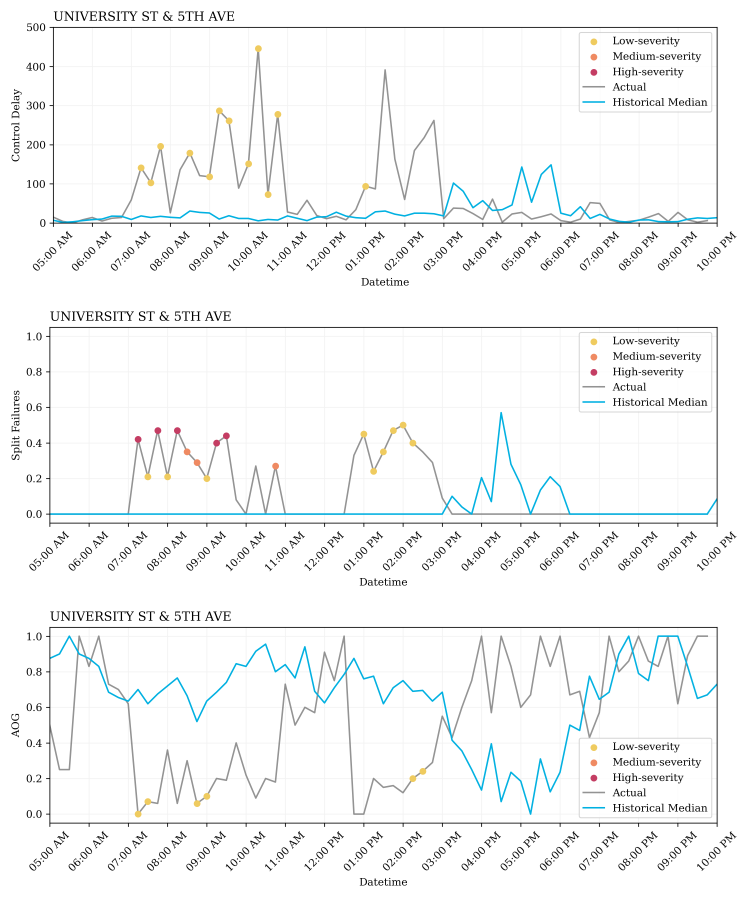 FIGURE 6: Anomalies by metric at UNIVERSITY ST & 5TH AVE on Wednesday 2/11
At University Street and 5th Avenue, the southeast-bound through approach experienced 35 anomalies, the most in the downtown study area. FIGURE 6 details the on-street experience that travelers and operators would recognize instantly.
Delay increased by more than 400 seconds at times, split failures rose, and arrivals on green fell. Like the hourly pattern in FIGURE 5, performance at this location was most constrained before and after the celebration events.
This data tells a familiar story to operators: arrivals, dispersal and recovery matter as much as the main event itself.
What the Numbers Say About People and Operations
These aren’t just anomaly counts—they describe choices and coordination. In Santa Clara, earlier and localized disruptions near Levi’s Stadium tell the story of arrivals concentrating around the venue and operations focused on protecting flow on critical approaches. In Seattle, the peaks just before and after the parade match natural crowd patterns.
People gather, they celebrate, and they linger, which creates waves that a prepared network can absorb.
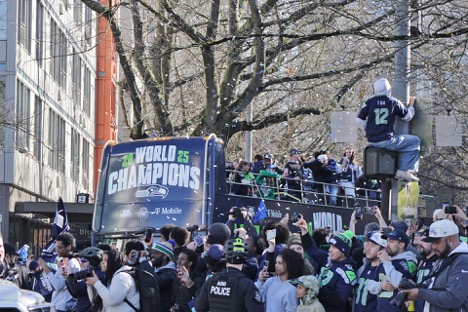 "Seattle Seahawks Super Bowl LX parade – 10.jpg” by SounderBruce, via Wikimedia Commons (CC BY‑SA 4.0).
The consistency of low to medium severity events, with a smaller share of high severity spikes, suggests that agencies kept most conditions within a manageable range even when demand was much higher than normal.
Without network-wide analytics, these dynamics often register only as anecdotes or isolated trouble spots. ClearGuide makes those patterns visible, measurable and actionable while special events are unfolding and long after they end.
The platform’s anomaly analytics help isolate where and when conditions diverge from seasonal norms, and the figures here illustrate how that view supports both day-of adjustments and post-event learning.
The combination of area-wide maps, distance distributions, time-of-day profiles, and movement-level metrics gives planners and operators a complete picture that a single average cannot.
Why This Matters After the Confetti
For agencies responsible for major event mobility, this kind of network-wide visibility is critical to allocating resources, managing public expectations and protecting system reliability.
The Super Bowl will always create surges. What changes is how prepared a region is to see them clearly and respond in real time.
The Santa Clara and Seattle analyses show that data-informed strategies can keep disruptions concentrated in space and time. They also show the value of seeing beyond one single corridor. A larger regional perspective can help agencies allocate limited resources to where they will matter most, whether that is a left-turn phase near a stadium entrance or a downtown approach that parallels a parade route.
For future large special events, the same methods apply. Define the footprint. Track anomalies against the seasonal baseline. Watch the distance profile to understand how far effects travel from the focal point. And when the day is done, capture the exact metrics that tell the story of what worked, and what can be expected next time.
Be Ready for What Comes Next
Major events, emergencies, and unplanned disruptions will always test a transportation network. ClearGuide helps agencies prepare by turning real-time and historical data into clear, actionable insights.
Request a demo to see how ClearGuide supports emergency and special event preparedness, from defining impact to monitoring anomalies and capturing lessons that improve response the next time it matters.
 Do major planned events disrupt traffic flow, compromise safety, or otherwise impact your community? Sports tournaments, music festivals, and seasonal tourist attractions can place stressors on quality of life and create congestion and risk on local roadways. Many agencies find event preparation and real-time management difficult given the administrative burden day-to-day operations already present.
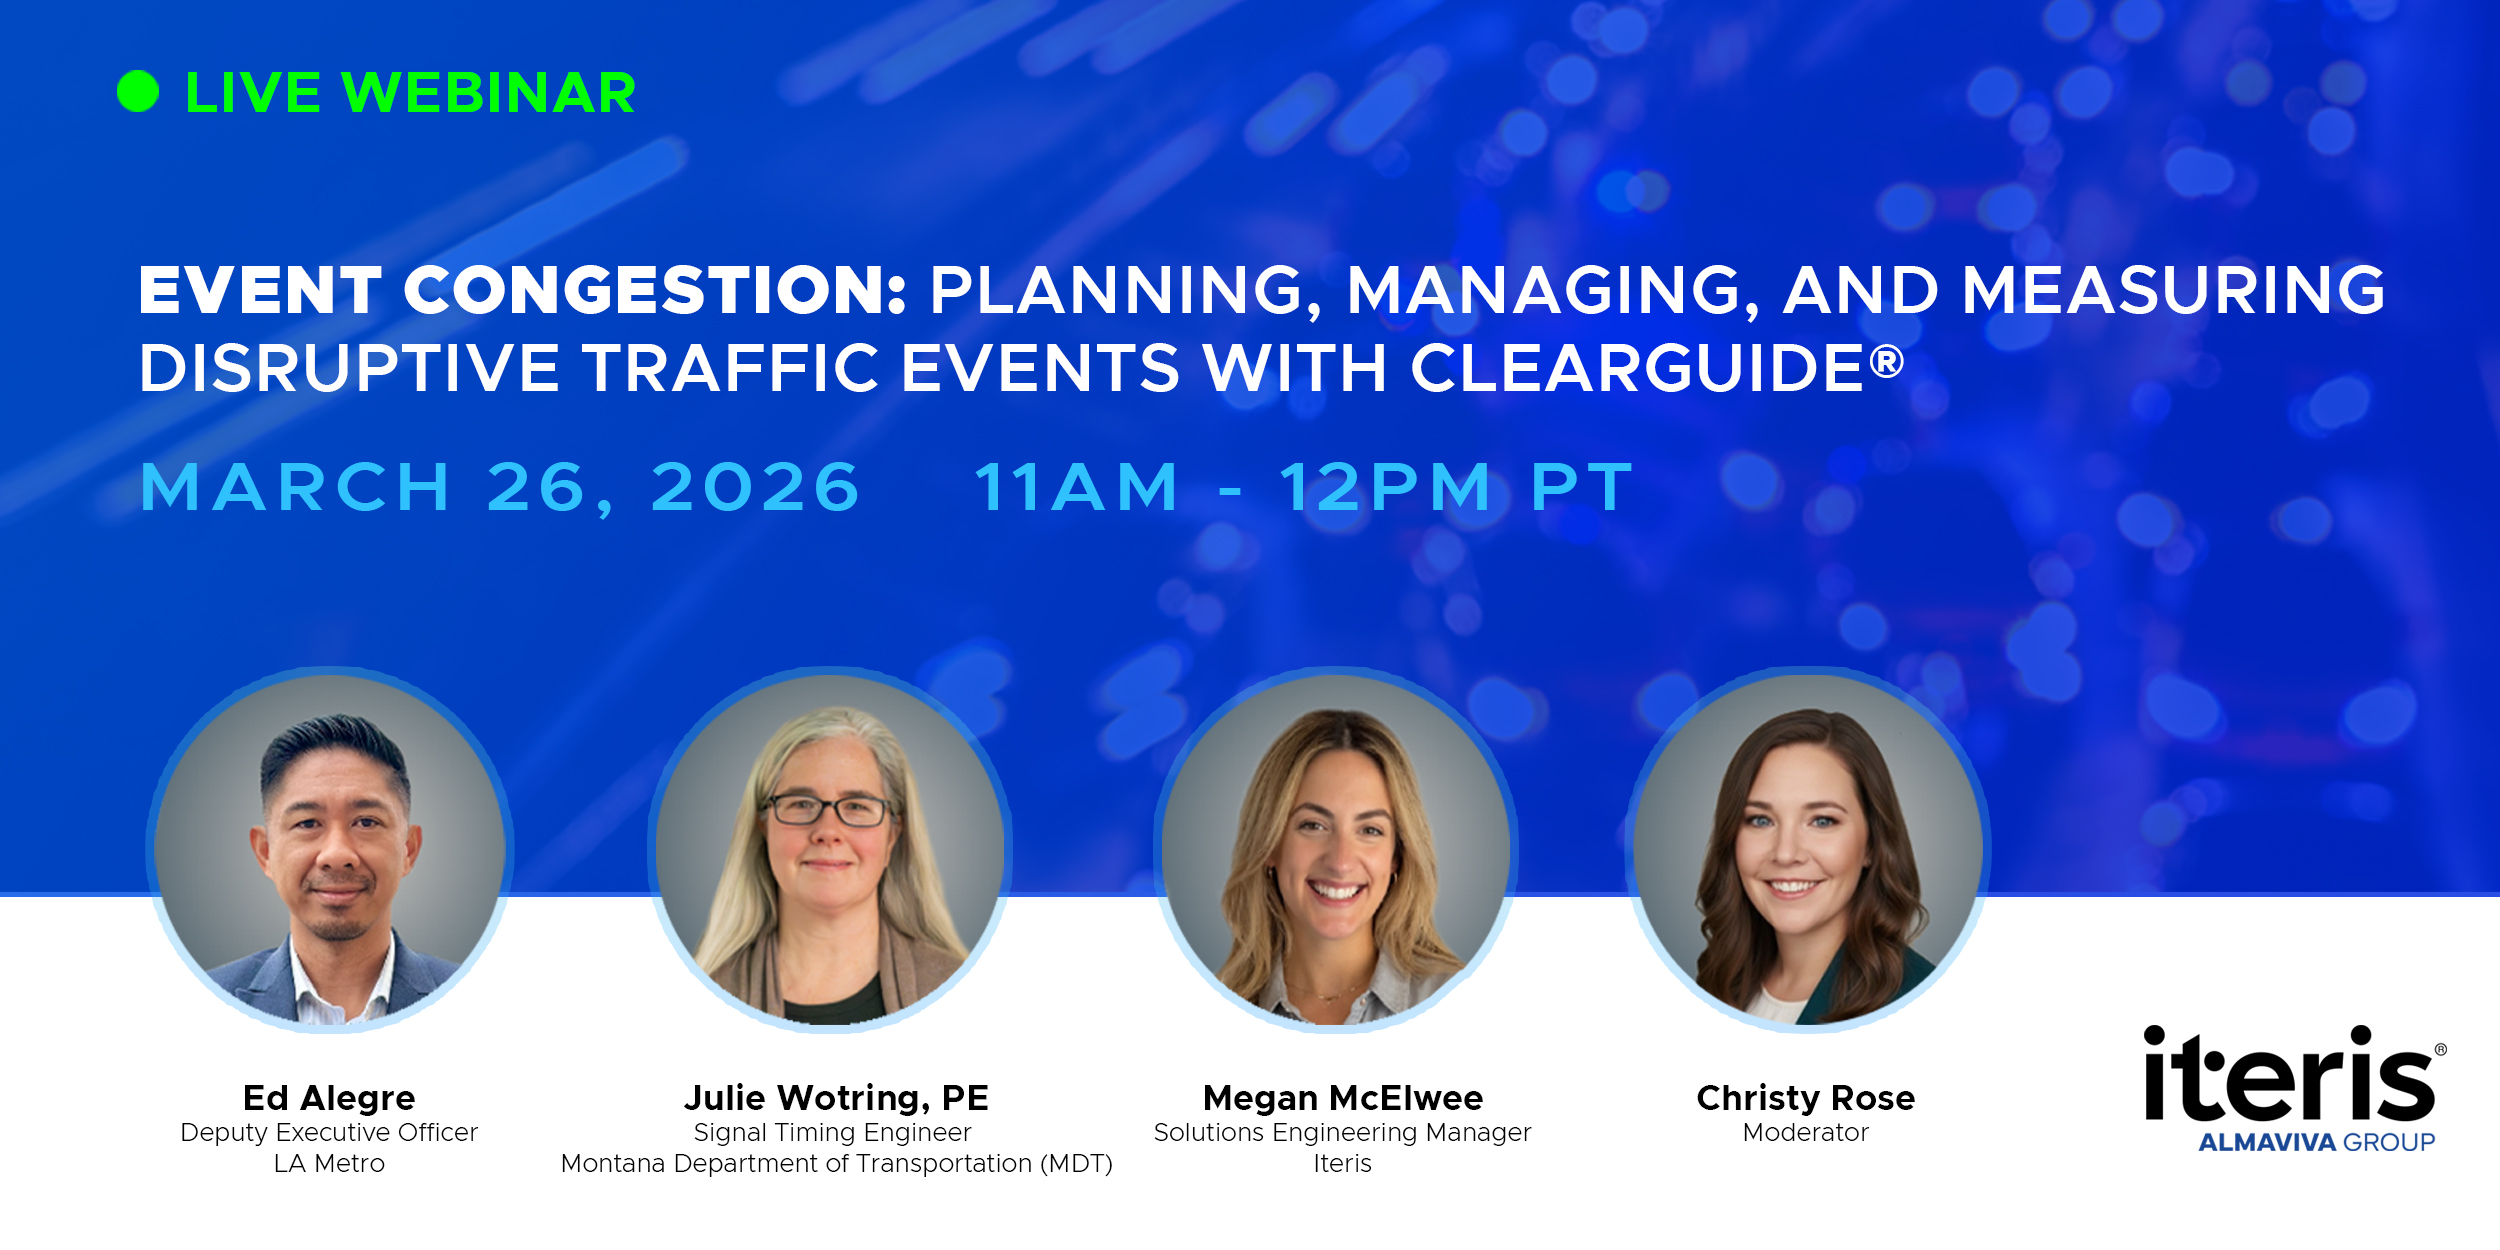
Watch our event congestion planning webinar, where Iteris, LA Metro, and the Montana Department of Transportation (MDT) came together to discussthe use of probe-based historical data, real-time alerts, and post-event analysis to support agencies in preparing for, managing, and measuring outcomes from planned disruptive traffic events.
 X
(Twitter)
X
(Twitter)
 Facebook
 LinkedIn
 Copy
Link
Copy
Link Email
EmailPost Topics
Related Posts

What’s Driving the DRAM Shortage – And What It Means for Transportation Technology
ITS America 2026: Real Conversations, Real Momentum and What Comes Next